
How An Excel Error Guided Conservative Economic Policies After The Great Recession
Exploring Reinhart and Rogoff's infamous 2010 paper.


September 15th, 2008. After 158 years in business, Lehman Brothers, the U.S.’s fourth largest investment bank, files for bankruptcy.
It’s the worst bankruptcy filing in U.S. history, occurring during the worst financial crisis since the Great Depression. An already battered stock market collapses further. Millions are unemployed. The world plunges deeper into a global recession. Some might even call it a great recession.
Governments are scrambling to prevent further chaos. Billions are poured into stimulus.

That’s a lot of money to fix a flailing global economy but in the end, it works. By the end of 2010, most countries are no longer in a recession.
But the relief wasn’t free. As government spending accelerated, so too did government debt levels.
Even before countries exited recessions, right-leaning politicians were calling for a reduction in government spending to contain ballooning debt-to-GDP levels.
The argument being that future economic growth would be hampered by debt obligations, an argument that still persists today. While the theory makes sense, the academic literature on what a catastrophic debt-to-GDP level was was still unclear.
That was, until 2010, when two economists released a now infamous paper that would provide the fuel for austerity.
The Paper:
In 2010, Carmen Reinhart and Kenneth Rogoff were two of the biggest experts in financial crises. Both had previously worked for the IMF, with Rogoff serving as Chief Economist from 2001 to 2003.
Together, they published influential research on sovereign debt and banking crises, as well as a recently published bestselling book, “This Time is Different” - which made them the perfect people for politicians to listen to to fix a growing debt concern.
By 2010, Reinhart and Rogoff had compiled over 200 years’ worth of data on government debt and growth for 44 countries, a data set spanning 3,700 data points - unprecedented for this type of research.
In 2010, they published a paper in the American Economic Review, one of the most prestigious economics journals in the world, and found that advanced countries with debt-to-GDP levels less than 90% experienced an average growth of around 3.5%. However, growth for countries with debt-to-GDP levels above 90% fell off a cliff. On average, their economies shrank, with an average growth of -0.1%.
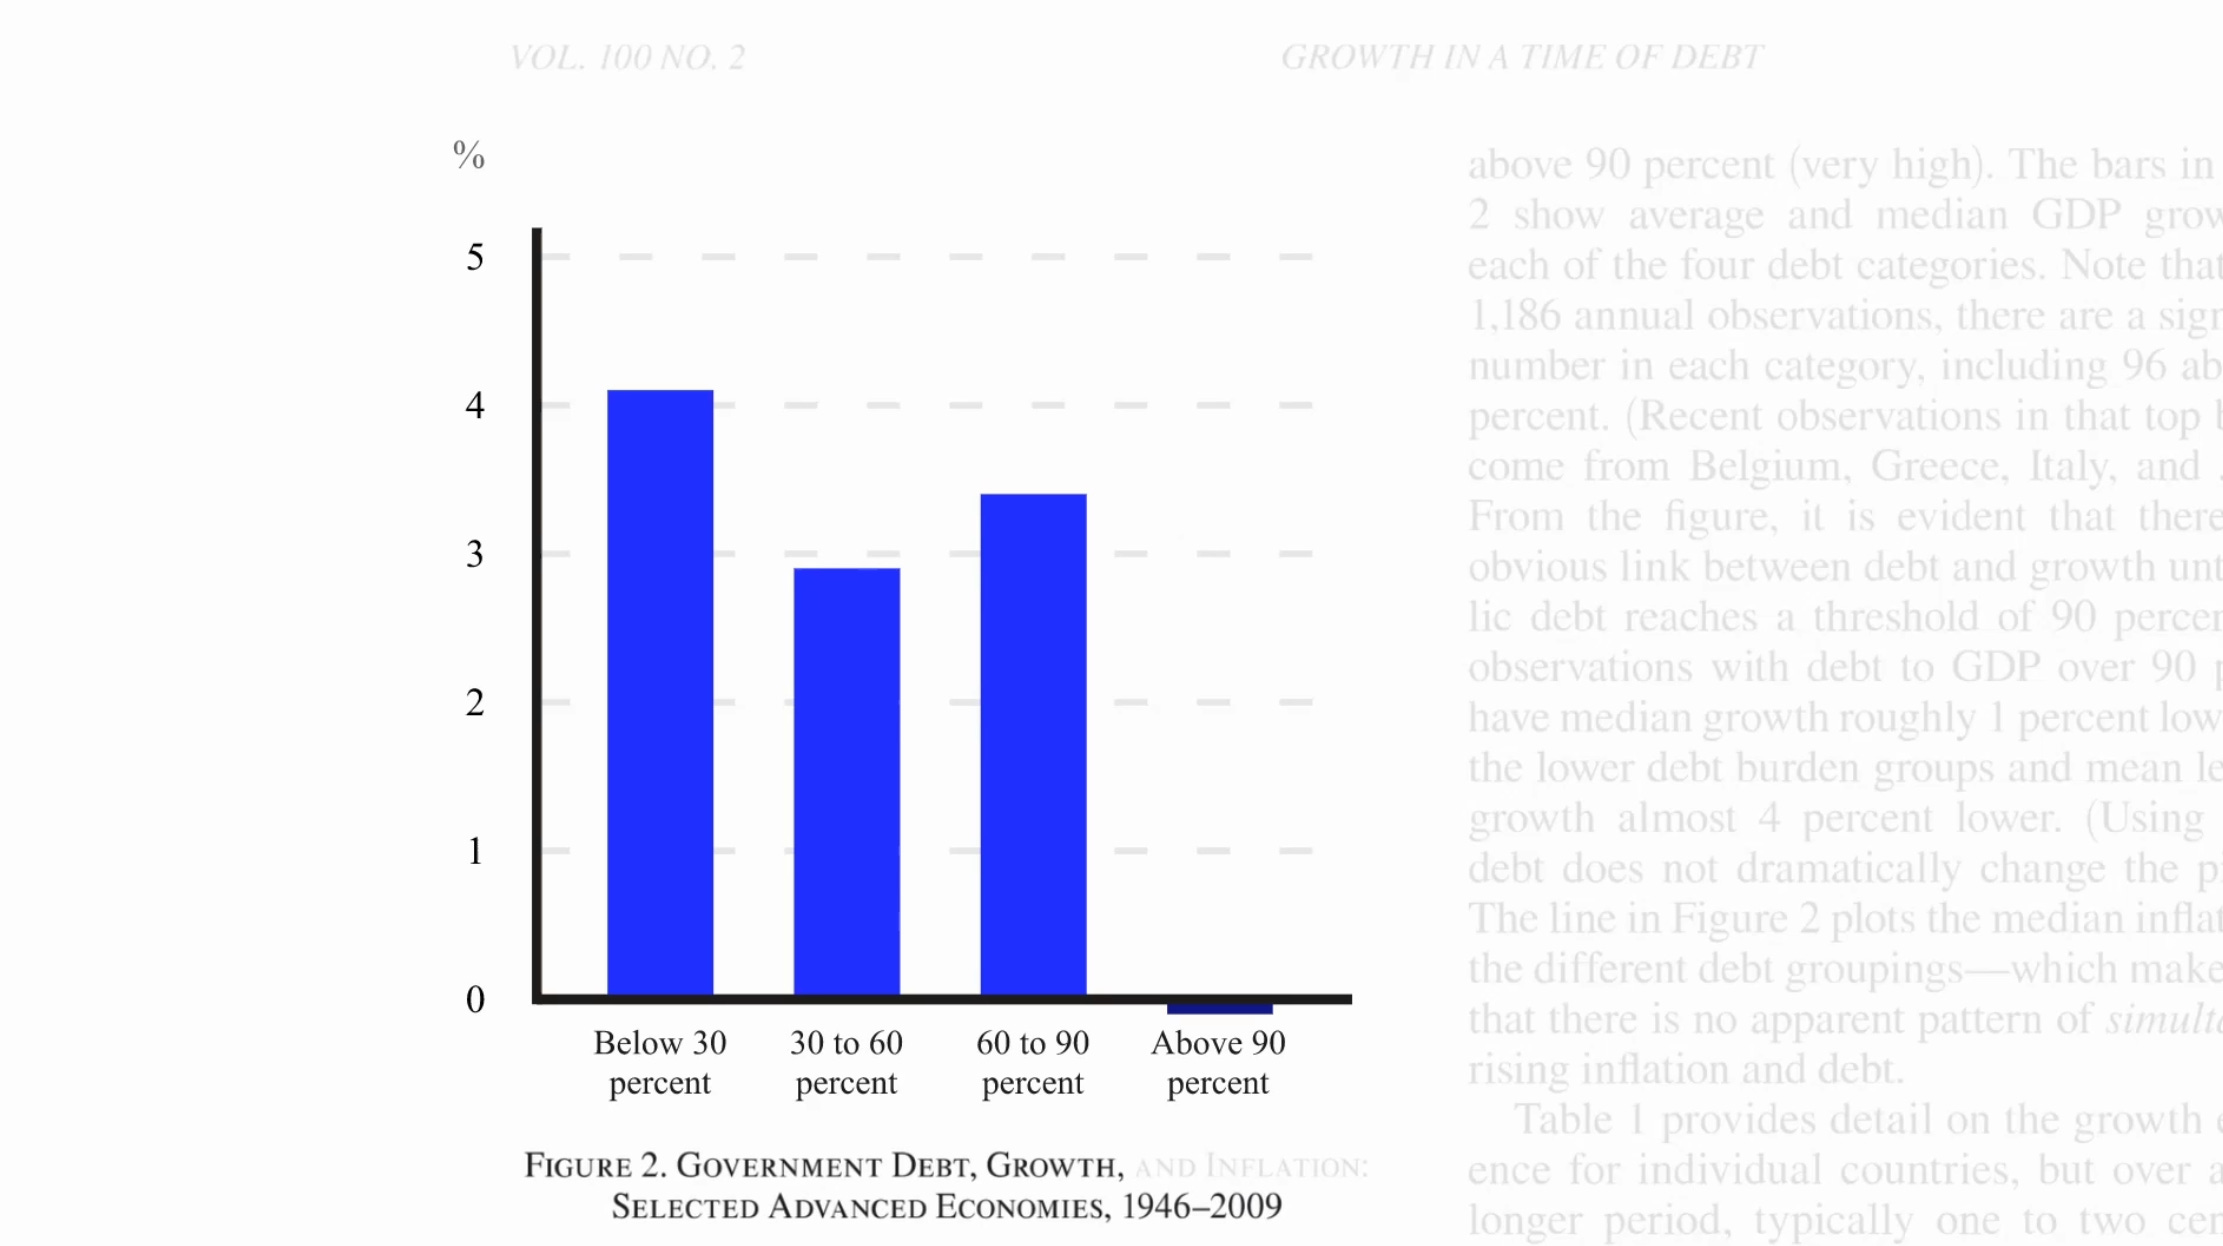
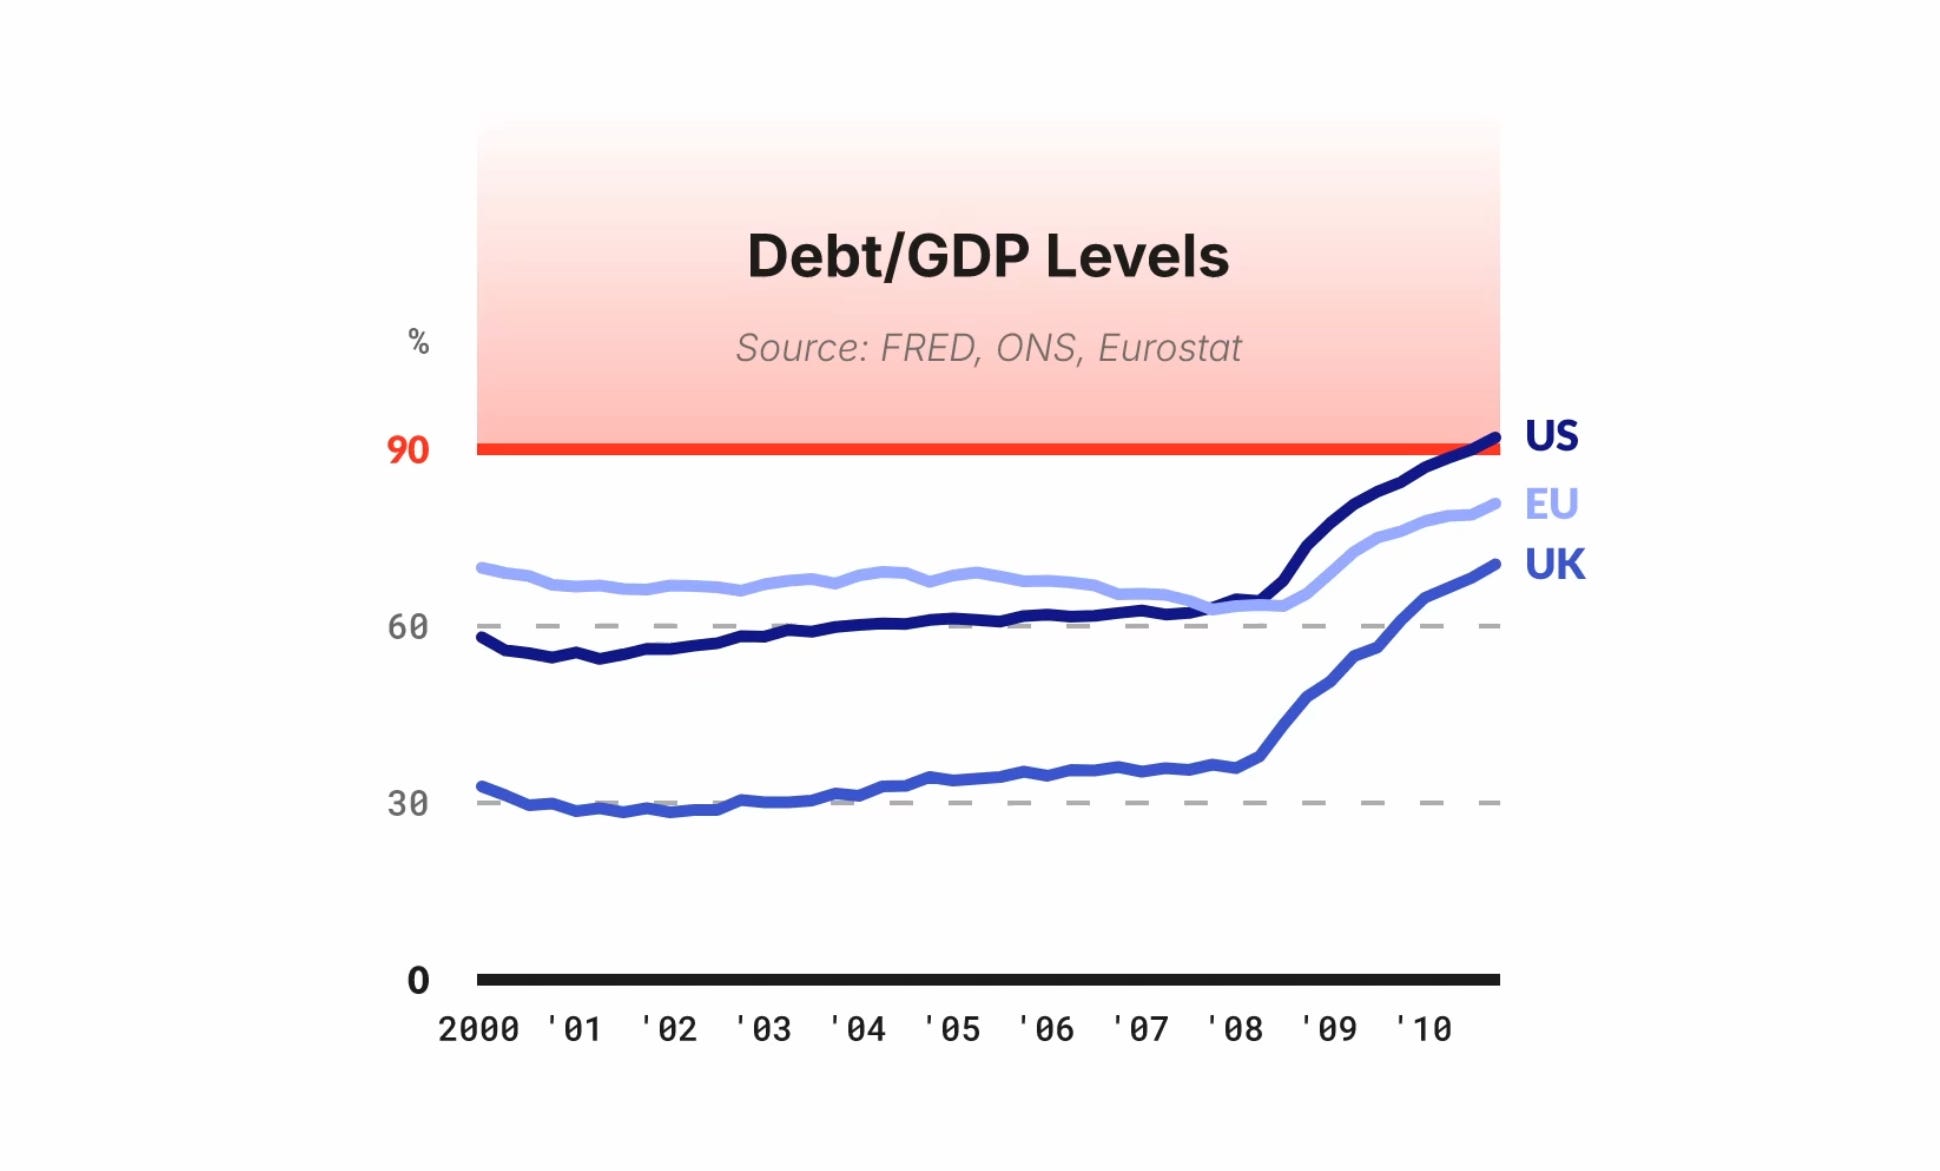
And this was a major concern. By the end of 2010, the US would cross this 90% threshold, and the UK and the EU wasn’t far behind.
Never mind that the paper wasn’t peer reviewed, the austerity that was being pushed by some politicians finally had justification for its existence, and they leaned on it hard.
The Influence:
In 2010, in a pre-election MAIS Lecture speech, UK Shadow Chancellor George Osborne promised austerity if the Conservatives won the UK General Election, citing “the latest research suggests that once debt reaches more than about 90% of GDP the risks of a large negative impact on long term growth become highly significant.”
In 2011, US Senator Jeff Sessions argued against new government spending, claiming that “as economists Rogoff and Reinhart demonstrated, we are losing at least a million jobs a year as a result our high debt.”
That same year, a Republican-produced Senate Budget Committee background paper argued for spending cuts over tax increases, warning that countries above the 90% threshold “tended to grow significantly slower.”
In 2013, EU Commissioner Olli Rehn defended existing European austerity policies, arguing that “serious empirical research has shown that at such high levels, public debt acts as a permanent drag on growth.”
And most damningly, House Budget Committee Chairman Paul Ryan’s “Path to Prosperity” - which proposed privatizing Medicare and slashing Medicaid - cited only one piece of economic evidence: Reinhart and Rogoff’s claim that “gross debt exceeding 90 percent of the economy has a significant negative effect on economic growth.”
And with the backing of so many politicians, so came the cuts.
In June 2010, now-Chancellor George Osborne announces an emergency budget with £40 billion in cuts, half a million public sector jobs eliminated, £18 billion cut from welfare, and the pension age raised.
In May 2010, Greece receives a €110 billion bailout - conditional on austerity imposed by the troika. Pensions slashed. Public sector wages slashed. The tax-free threshold slashed.
Across the continent, the troika gut the Portuguese health budget. Emergency room visits jumped from €9.60 to €20, and nurse consultations were charged for the first time. Arguably, a spike in deaths in 2012 was attributed to these austerity measures.
In Ireland, all budgetary decisions required troika approval, and fiscal performance was to be subject to quarterly reviews, leading to deteriorated public services in health and education.
In the US, sequestration begins in 2013. $85 billion in spending cuts starting immediately, and $1.2 trillion planned over ten years.
These were just a few examples, but one thing was clear: around the world, austerity had arrived.
But there was one problem. One that wouldn’t be discovered until three years after Reinhart and Rogoff’s paper.
The Discovery:
2013, Thomas Herndon, a PhD student at the University of Massachusetts Amherst, is given an econometrics assignment: replicate the results of a famous paper. He chooses Reinhart and Rogoff’s 2010 study. He gathers the data, follows the methodology, and runs the calculations.
But his numbers don’t match.
After reaching out to Reinhart and Rogoff, Herndon receives the original Excel file and can’t believe his eyes. The influential paper that formed the backbone of fiscal decisions implemented around the world was riddled with basic Excel mistakes and questionable methodological choices.
Mistake 1: Exclusion of data
In the highest debt category, Reinhart and Rogoff excluded several years from Australia, New Zealand, and Canada. The exclusion of some of New Zealand’s data was particularly damaging, as the excluded data represented annual growths of 7.7, 11.9, -9.9, and 10.8 per cent, an average of 5.13 per cent.
What was left in their analysis was New Zealand’s growth of -7.6 per cent, which, along with an unconventional weighting mentioned later, heavily dragged down the average growth in this category. Including the missing data would have increased the self-reported 96 data points in the highest debt category to 110.
But there were actually 71, because…
Mistake 2: Excel error
In all the debt categories, Reinhart and Rogoff forgot to include data from Australia, Austria, Belgium, Canada, and Denmark. And if you’re wondering what these countries have in common, they’re the top 5 advanced economies alphabetically.
Yep, Reinhart and Rogoff literally forgot to extend their excel formulas to include the first 5 countries.
Mistake 3: Unconventional weighting
Remember New Zealand’s sole data point in the highest debt category? -7.6 per cent?
The UK had 19 years worth of data, at an average of 2.4 per cent. If you had these 20 total data points - one from New Zealand, nineteen from the UK - how would you calculate the average?
The conventional way would be to add all your data points and divide by 20 to get an average of 1.9 per cent.
What Reinhart and Rogoff did was they took the average of New Zealand’s growth, -7.6 per cent, and the average of the UK’s growth, 2.4 per cent, and averaged those numbers, to arrive at -2.6 per cent.
Doing it this way places a weighting on New Zealand’s data that is 19 times the UK’s data. A decision that is “arbitrary and unsupportable” according to Herndon.
After correcting for these three mistakes, growth in the 90%+ debt category jumps to 2.2%. Still lower than the other categories, but nowhere near as catastrophic.
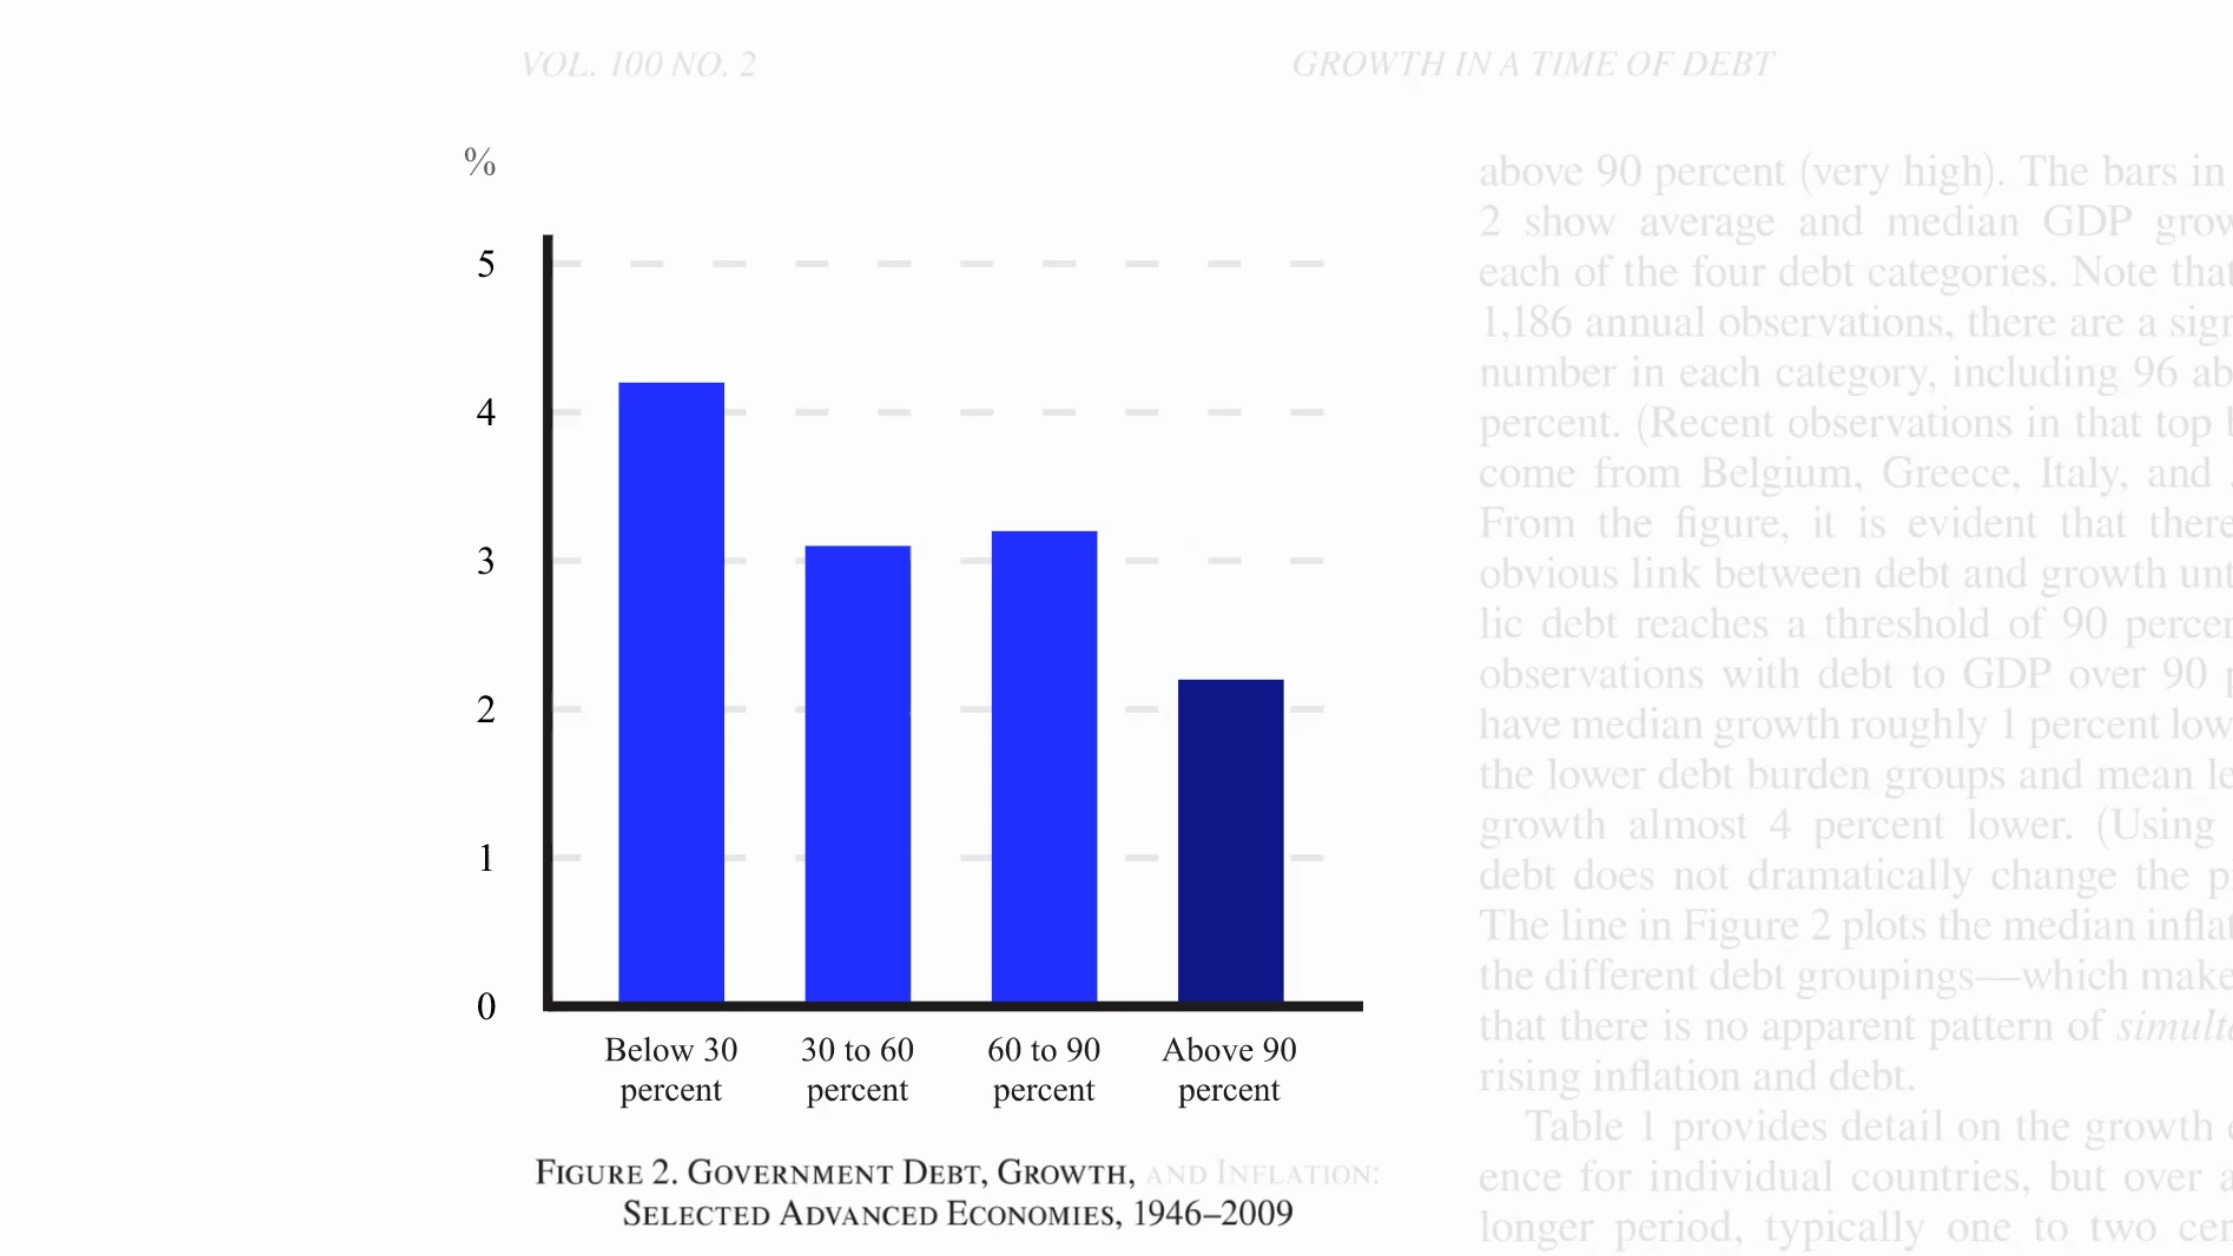
A 90% debt level isn’t the “large negative impact” as described by George Osborne, isn’t the “permanent drag on growth” like Olli Rehn said, and isn’t the “significant negative effect on economic growth” as cited in Paul Ryan’s budget.
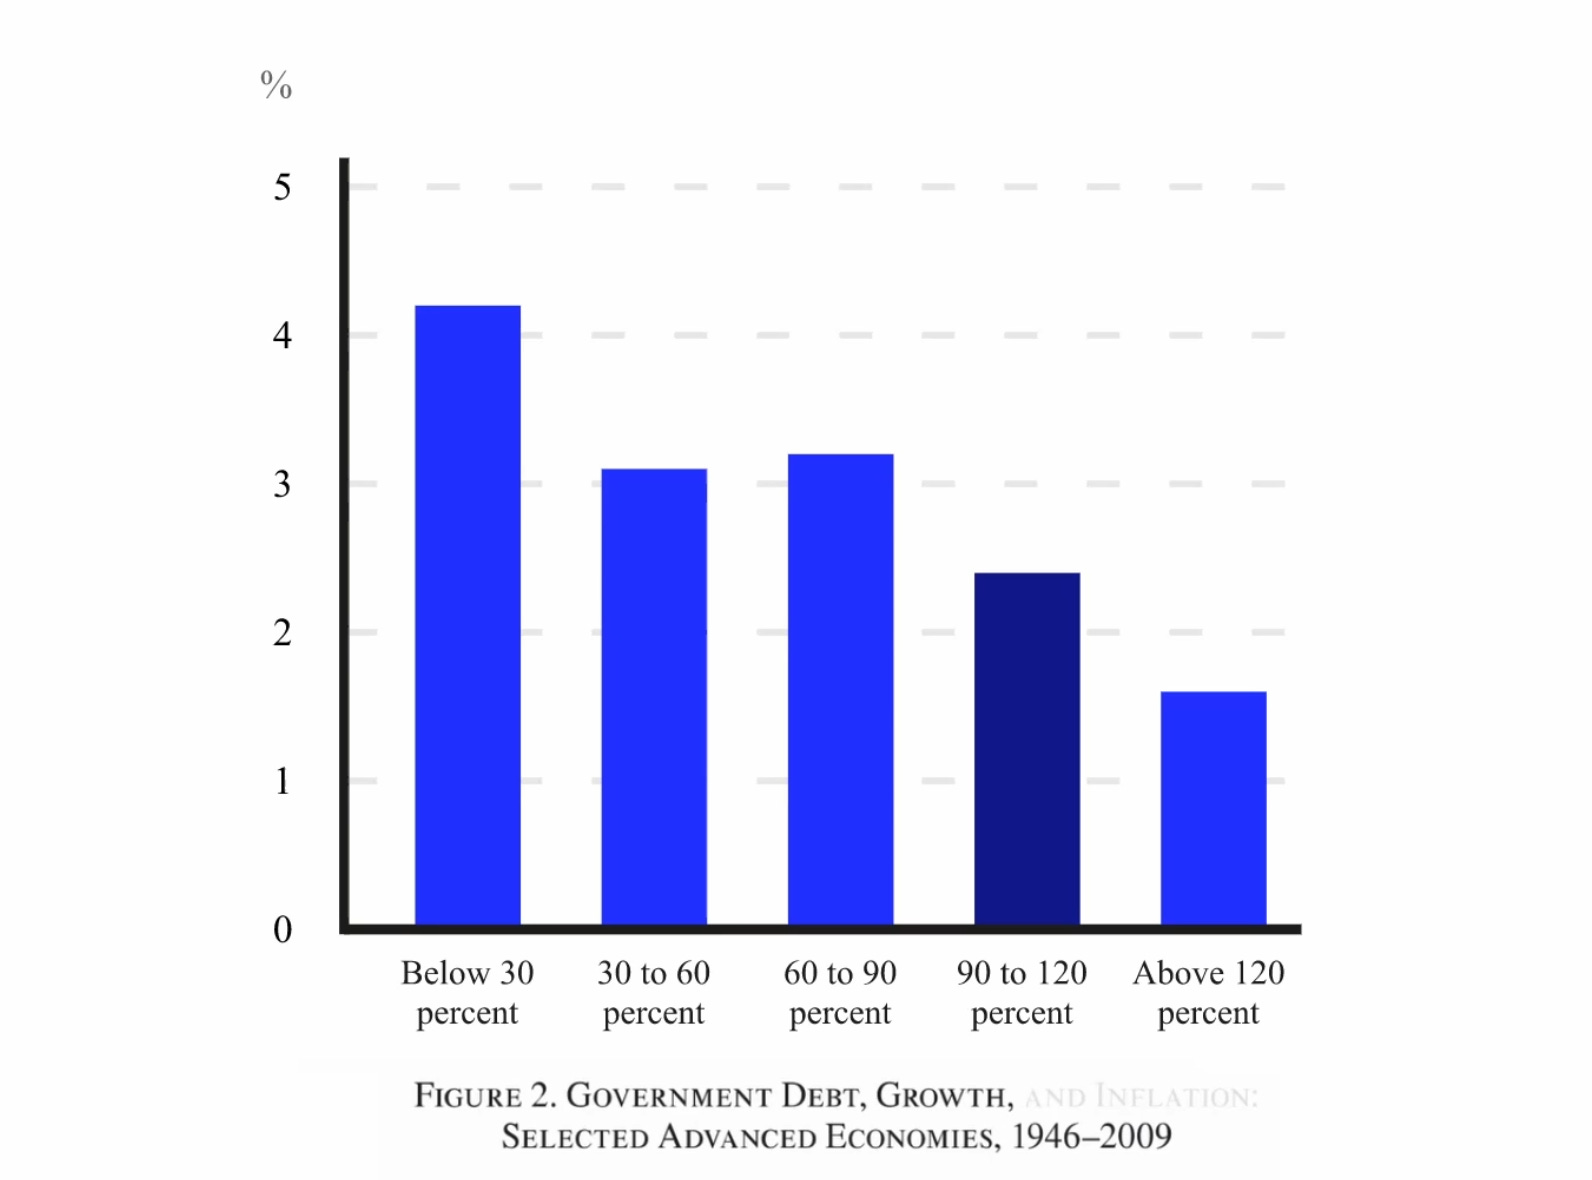
In fact, splitting the 90%+ debt-to-GDP category into a 90-120% category and a 120%+ category, finds an average growth of 2.4% in the 90-120% category, a number statistically similar to the lower three categories.
The Aftermath:
Herndon, along with his supervisor and professor, Ash and Pollin, publish their paper in April 2013, to a resounding silence by the austerity pushing politicians.
Reinhart and Rogoff acknowledged the findings, saying “it is sobering that such an error slipped into one of our papers” but still believed in the central message of the paper.
EU Commissioner Olli Rehn does make a comment to Bloomberg Television after the paper is published: “We are not deciding our economic policy in Europe on the basis of one single study.”
George Osborne also pushes back, saying “The contribution that Rogoff and Reinhart have made to our understanding of the impact of financial crises goes far beyond” one error in a spreadsheet.
So the austerity measures continue.
In 2015, George Osborne announces even more cuts to government departments. In 2017, the new Chancellor Philip Hammond confirms the continuation of austerity.
By 2019, the Institute for Public Policy Research found that austerity in the UK had been linked to 130,000 preventable deaths in the UK since 2012. The New Economics Foundation calculated it had shrunk the British economy by £100 billion.
In Greece, austerity increased the debt-to-GDP ratio from 127% to 179% - not because debt grew, but because austerity crushed the economy by 25%. The policy justified by Reinhart and Rogoff’s research made the very problem it claimed to solve even worse.
The Lesson:
So what’s the real tragedy here? Obviously it’s the millions of lives that were destroyed by austerity, but I think this story is more than just the excel error. Mistakes happen, especially in a non-peer reviewed paper.
It’s that people are ideological and suffer from confirmation bias. There were politicians who started off wanting a smaller government, found research to support their position, and used it to justify their positions.
Never mind it wasn’t peer reviewed, never mind there were Nobel winning economists like Krugman and Stiglitz arguing the opposite, and especially never mind the excel mistakes that were found later. It was never about the research anyway, it was just used as a prop to push their ideology.
And this is true for everyone across the political spectrum, not just conservative politicians. People cherry-pick statistics that confirm their beliefs and dismiss evidence that challenges them. This was just one of the most significant cases in recent history.
Good thing this happened in 2013 and no one acts like this anymore.
Thanks for reading! This is a transcript of a YouTube video, you can check out here.